Bode plot measurements are essential for system stability and transient response optimization. This post describes how the connection wires affect bode plot measurements and the methods to improve measurement accuracy.
Figure 1 shows a typical Bode plot measurement setup with a broken control loop and a small resistor inserted. The frequency analyzer has a source that injects an AC disturbance, ṽds, across this small resistor. This setup also usually includes an isolation adapter.

Figure 1: Typical Bode plot measurement setup
AC fluctuation occurs at the two nodes, A and B, across the breaking point. The frequency analyzer has two receivers to measure signals at nodes A and B, ṽA and ṽB. You can calculate the system loop gain, TV, with Equation 1:

(1)
Equations 2 and 3 calculate the voltage at nodes A and B, respectively:

(2)

(3)
How and why connection wires affect Bode plot measurements
In an actual setup, you would have to solder connection wires to the two ends of the small resistor and connect both the disturbance-injection and signal-measurement cables to the other ends of the wires. Figure 2 shows a more accurate block diagram of the actual test setup.
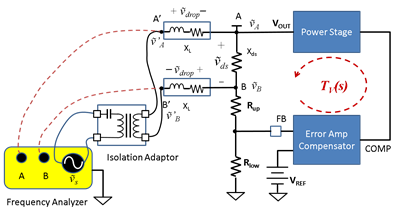
Figure 2: Bode plot setup with a single pair of connection wires
The signal receivers A and B measure not only ṽA and ṽB, but also the voltage drop across the wires, ṽdrop. Equations 4 and 5 calculate the measured signals, ṽ’A and ṽ’B:

(4)

(5)
Where Xds is the impedance between the break points and XL is the impedance of the shared wires. Xds is usually dominated by the resistor inserted between point A and point B.
Thus, the measured loop gain, TV_measure, is affected by the impedance of the wires’ XL, as shown in Equation 6:

(6)
At low frequency, when |TV| >> |Xds/XL|, Equation 7 can approximate |TV_measure|:

(7)
At high frequency, when |TV| << 1, Equation 8 can approximate |TV_measure|:

(8)
When |XL| is comparable to |Xds|, TV_measure is much different than the TV. Because designers rely on Bode plots for stability and load-transient response optimization, this measurement error greatly affects the system’s ultimate performance.
Figure 3 shows |XL| (the impedance of wires of different lengths and gauges), with the two wires at a distance of 1 inch.
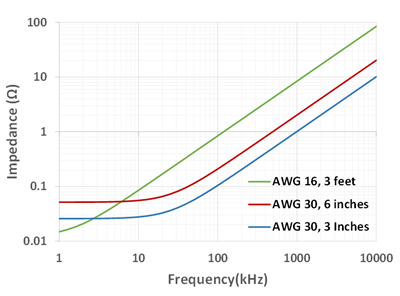
Figure 3: Wire impedance of different lengths and gauges
Recommended solution
To minimize measurement errors, the best practice is to add a separate pair of wires for measurement only, as shown in Figure 4. This method excludes the voltage drops across of the wires from the measurement.
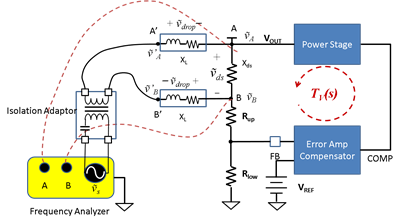
Figure 4: Recommended frequency analyzer wire connection
To verify the concept, I first compared Bode plots measured with two pairs of connection wires, as shown in Figure 4, with a single pair of short-length connection wires. Figure 5 shows the comparison. The two Bode plots have identical crossover frequency and both have a gain margin over 10dB.
 Figure 5: Bode plots with the setup shown in Figure 4 and the setup with short connection wires
Figure 6 shows the transient response of the converter under test. The response corresponds to a stable system.
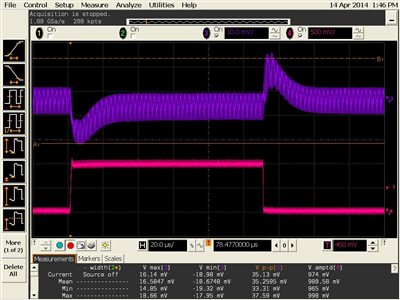
Figure 6: Transient response of the converter under test (load step is 5A, purple – VOUT; pink – load step)
Figure 7 compares Bode plots measured with one pair of American Wire Gauge (AWG) 30 wires 6 inches long and two pairs of AWG 30 wires, also 6 inches long. The Bode plot measured with one single pair of connection wires (also shown in Figure 2) has a gain margin less than 8dB. In this example, the engineer had a strict requirement on stability requiring a gain margin over 10dB. Based on the erroneous measurement, the engineer could have to sacrifice the control bandwidth and transient response to make up the gain margin. This is not a desirable situation.
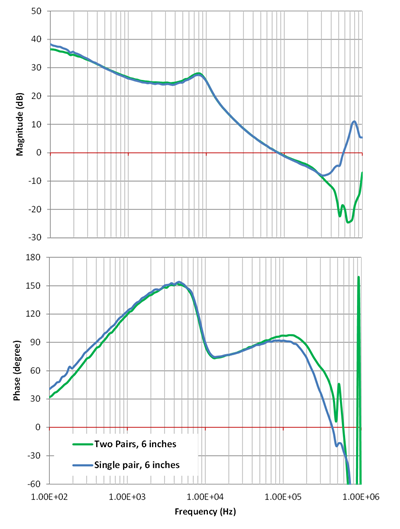 Figure 7: Bode plot measurement comparison with the setup shown in Figures 2 and 4
Isolation toolbox limitations
Certain frequency analyzers might come with an isolation toolbox that pre-connects the receivers A and B to the output of the isolator, as shown in Figure 8. The toolbox is designed to lower the connection wire count. Doing so, however, forces the two receivers to include the voltage drop across the connection wires. Figure 3 shows the impedance of one 3-foot AWG 16 wire. Around 1 MHz, the impedance rapidly increases to over 10Ω.
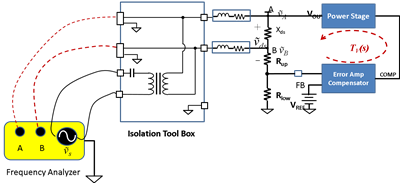
Figure 8: Example toolbox connection
Figure 9 compares a Bode plot measured with a toolbox and two 3-foot cables of AWG 16 measured with two pairs of wires. The Bode plot measured with the toolbox has a gain margin less than 6dB, which falsely indicates a marginal stability.
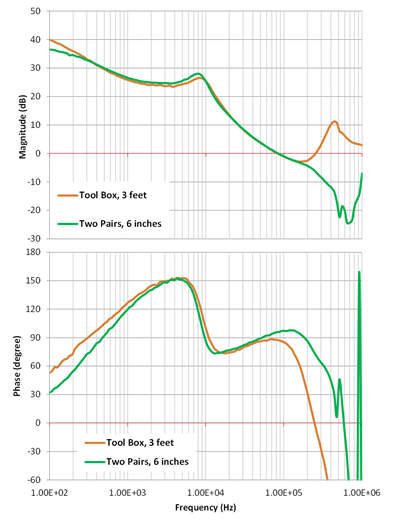 Figure 9: Comparison of Bode plots measured with a toolbox and the setup shown in Figure 4
The isolation toolbox is a convenient tool. However, the impedance of the connection wires at high frequency affects the Bode plot measurement too much. This misleading Bode plot would hinder the process to improve transient response. When using the toolbox, you should always use cables of minimal length. For systems that have high control bandwidth, I do not recommend the toolbox.
In this post, I showed how and why connection wires could affect Bode plot measurements. The best approach is to add a separate pair of connection wires to the breaking points for measurement only. In applications where adding a separate pair of connection wires is not feasible, keep the connection wires as short as possible.
Additional resources
- Read the related blog post, “How to set up a frequency analyzer for Bode plot.”
- Read the application note, “How to Measure the Loop Transfer Function of Power Supplies.”
- Read the AP300 frequency response analyzer manual.
- Read more Power Tips blogs.