I was recently evaluating the TRF3720 fully-integrated IQ modulator and PLL/VCO linearity performance for a specific customer requirement. While measuring the OIP3 performance I observed unexpected spurs as shown in Figure 1 below. After discussing with my colleagues we concluded digital analog converter (DAC) baseband (BB) images mixed with TRF3720 voltage control oscillator (VCO) and local oscillator (LO) generated these spurs. Incorporating BB filters minimizes such spurs. This blog discusses how these spurs appeared at the modulator output.

Figure 1: OIP3 measurement spectrum analyzer screenshot
Figure 1 shows the spectrum analyzer screen shot with two RF tones (RF1 and RF2), and two inter modulation distortion (IMD) tones (IMD1 and IMD2), along with the two spurs (SPUR 1 and SPUR 2). BB frequencies BB1 123.6MHz and BB2 183.6MHz were used. TRF3720 was programmed at LO 1986.56MHz with VCO operating at 2xLO i.e. 3973.12MHz. As the separation between the spurs (60MHz) is exactly same as RF or BB tone separation it is concluded that these spurs were generated from BB.

Figure 2: Set-up block diagram and picture
Figure 2 shows the block diagram of the set-up along with the picture. TRF3720 is cascaded to DAC38H84. TSW1400 pattern generator was used to generate baseband (BB) signals.
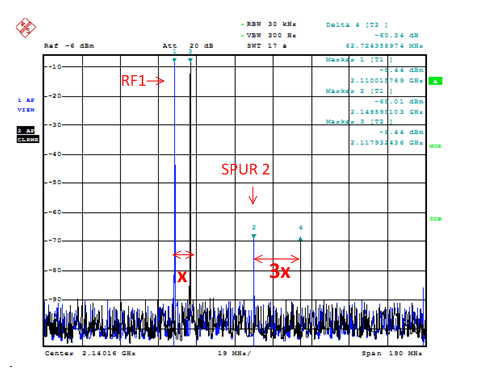
Figure 3: Spectrum analyzer screenshot with BB2 turned off
Figure 3 shows the spectrum analyzer screenshot with BB2 turned off. SPUR2 is the mixed product of BB1. This picture also shows a black trace which was captured increasing LO by ‘X’ Hz. Moving the LO by ‘X’ Hz, moved SPUR2 by ‘3X’Hz. This indicates that ‘SPUR2’ is most likely mixed from VCO (operating at 2xLO) by ‘2X’ Hz along with LO by ‘X’ Hz.

Figure 4: DAC output response
Figure 4 shows the DAC output response. DAC output has desired BB frequency along with DAC images located at . Here n is an integer from 1 to ∞ and -1 to -∞. With the DAC clock rate 1228.8MHz and BB1 at 123.6MHz, BB1 DAC images are at 1105.2MHz, 1352.5MHz, 2334MHz, 2581.2MHz, 3562.8MHz, 3810MHz, etc. These DAC images when mixed with the VCO generate some products at ]. These products when mixed with LO generate some products at LO . After observing these products the spurs shown in Figure 1 were mixed product of . One of the BB1 (123.6MHz) DAC images generated SPUR2 (2149.48MHz) and one of the BB2 (183.6MHz) DAC images generated SPUR1 located at 2089.68MHz.
Generally, spurs from the DAC images mixed with VCO, LO, and references and fall in the desired modulated output spectrum of the modulator. Such spurs are minimized by incorporating BB filters between DAC output and modulator baseband inputs.
For more info on DAC basics check out “High Speed, Digital to Analog Converters Basics”. Or, for more info on DAC and modulator interface check out “Analog Interfacing Networks for DAC348x and Modulators”.