Quantcast
Channel: TI E2E support forums
Viewing all 4543 articles
Browse latest View live

Differential pairs: what you really need to know

$
0
0

The demand for speed is ever increasing, and transmission rates are doubling every few years. This trend is seen in many modern communications systems such as PCIe in computing, SAS and SATA in storage, and Gigabit Ethernet in cloud computing. This information revolution presents huge challenges in delivering data through transmission media, which continue to rely on copper wires and serial bit-stream transfers with a symbol rate >25Gbps and a throughput rate >100Gbps in a data link.

 These serial data transmission designs use differential signaling to deliver data through a pair of copper wires called a differential pair. The complementary signals in the A-wire and B-wire are high-speed pulses of equal amplitude but opposite in phase. Many circuit technologies are used in differential signaling: low-voltage differential signaling (LVDS), current mode logic (CML) and positive emitter-current logic (PECL) are a few examples.

 Delivering a perfect serial bit-stream

 The serial bit-stream is a pair of differential signals propagated through a differential pair. As shown in figure 1, the differential signals are expected to arrive at the same time so that they retain the properties of a differential signal (with equal amplitude, opposite in phase) at the receiving end. A receiver is used to restore the signal fidelity, then sample and recover the data correctly, achieving error-free data transfer.


Figure 1: Electrical properties for a perfect differential pair

 Requirements for a differential pair

 Implementing a well-designed differential pair is a key factor in successful data transmissions at high speeds. Depending on the application, the differential pair can be a pair of printed circuit board (PCB) traces, a pair of twisted-pair copper wires or a pair of parallel wires sharing a dielectric and shielding (usually called twin-axial cable). In this series, I’ll discuss the characteristics of differential pairs, as well as the design challenges and solutions for high-speed data transmission.

 For this first installment, let’s examine the main requirements for a differential pair:

  • Both the A-wire and B-wire need to maintain fairly constant and equal characteristic impedance, commonly called odd-mode impedance, when both wires are excited differentially.
  • The differential signals should arrive at the destination while preserving the differential signal’s properties: approximately equal amplitude and opposite in phase.
    • The insertion loss of each wire should be approximately equal.
    • The propagation delay of each wire should be approximately equal.

 In summary, we are looking for equal and fairly constant odd-mode impedance, minimizing the impedance fluctuation along the length of the differential pair from its source to destination. We are looking for delay matching and insertion loss matching between the A- and B-wires. In addition, we need to make sure the insertion loss is not excessive so that the receiver can recover the data correctly.

To satisfy the above requirements, the A- and B-wires should maintain a high degree of symmetry in their physical layout. The transmitter and receiver should also be highly symmetric in their A- and B-wire circuitry so that they present equal electrical loadings to the A- and B-wires.

Designing differential pairs to minimize distortion

In an ideal world, differential pairs are perfectly symmetrical, have unlimited bandwidth and offer complete isolation from adjacent signals. In the real world, differential signals propagate through integrated circuit (IC) packages, external components, different PCB structures, connectors and cabling subsystems. Implementing a perfectly symmetrical differential pair is a big challenge. In future posts, I’ll discuss differential pair design trade-offs and mitigation techniques to minimize distortions to transmitted signals.

Texas Instruments has a rich portfolio of high-speed signal-conditioning ICs, such as retimers and redrivers. They ease the challenge in mitigating imperfections and high insertion loss from all styles of differential pairs, enabling reliable data communication and extending transmission distance for modern systems.

 Find out more about TI’s LVDS/MLVDS/ECL/CML and signal-conditioning redrivers and retimers. I hope you’ll read the rest of my series on differential pairs.

Additional resources


Help Mom find her Qi

$
0
0

You’ve heard the expression “busy mom” and have seen her in action. From shuttling kids to school and extracurricular activities to juggling her own schedule, she is constantly on the go.

TI AvatarAnd most moms will tell you what they really could use is a little more energy.

With Mother’s Day coming up May 10 in the U.S., here are a few gifts that give her just that: energy. Courtesy of TI technology, of course.

Qi (pronounced “chee”) is a Chinese word that refers to the energy that flows through all living things. In other terms, Qi is also a technology standard that powers a convenient new way to recharge the batteries in smartphones, tablets and other handheld devices.

And TI is the standard’s acknowledged leader.

Which leads us to TYLT’s VŰ series of wireless chargers and Belkin’s new Qi Wireless Charging Pad, both of which can give Mom’s energy level – or at least her phone’s – a needed boost.

All she has to do is place her Qi-compatible device on the charging surface and the power flows from the charger into the device’s battery, without those pesky wires getting in the way.

Making that happen is TI’s job. Both chargers are built around TI Qi-compliant wireless power transmitter managers. Belkin’s pad uses the bq500212A, a low-cost single-coil transmitter, while TYLT’s devices rely on the bq500412, a three-coil chip that offers more flexibility in the position of the device in that it doesn’t have to be as precisely aligned on the pad to charge.

“They’re the equivalent of an antenna for a radio transmitter that sends the signal out,” TI applications manager for wireless power Upal Sengupta explained. “The handheld product – a tablet, a game controller, a phone – has the receiver. You set it on the transmitter, which radiates energy out, and the energy is received and charges the battery.”


Emerging technology

Because wireless charging is an emerging technology, not every smartphone has it built in – yet.

Currently, some percentage of mobile devices include capability for wireless charging, though many can be enabled for it with devices like TYLT’s VŰ-MATE wireless charging card, a Qi-compatible wireless power receiver that fits over a phone’s battery (which, not coincidentally, is powered by a TI receiver chip – the bq51013B).

“If you have a flagship smartphone, there is a high likelihood you either have wireless charging built in or through an OEM developed back cover,” said Kalyan Siddabattula, systems manager for the team. “It’s super convenient and OEM approved so it offers the best experience, and best of all, they will have TI silicon inside.”

Upal sees wireless charging becoming a standard feature on all smartphones. He envisions wireless power evolving the same way wireless Internet has evolved over the past several years to the point that it’s now expected to have wireless data access in homes, as well as coffee shops, hotels and virtually any other public place.

“The idea with wireless power is that everybody will have one of these pads in their house, sitting on their nightstand or wherever,” he said, “And when you go to a restaurant you’ll set your phone down on the table and it will charge. Whenever you go to work, you’ll have a charging surface built into your desk or in your meeting room. And we’re working with some automakers to build it into their vehicles so when you get in your car, you just set the phone down on the console and it charges. You don’t have to fumble around trying to connect the thing while you’re driving.”


Understanding Voltage References, Part 3 - How to achieve shunt reference flexibility with series reference precision

$
0
0

In the first post in our Understanding Voltage References series, my colleague Christopher Dean explained how to pick the one voltage reference topology for your system.  Today I’ll address how to achieve shunt reference flexibility with series reference precision.

A series voltage reference is a three-terminal device: VIN, VOUT and GND.  It is similar in concept to a linear voltage regulator (LDO) but designed for a lower quiescent current and much higher accuracy.  It may be thought of as the voltage-controlled resistance, VCR, between the VIN and VOUT.  It regulates the output voltage by adjusting its internal resistance such that VIN minus the drop across the resistance, R, equals the reference voltage at VOUT; see the block diagram in Figure 1.

Figure 1: Series Voltage Reference - VCR Model


The series references generally have much better initial accuracy and temperature drift coefficient than do shunt references.  Thus, if you need better than 0.1% initial accuracy and/or less than 25ppm/deg C temperature drift, you will most likely need a series voltage reference. 

However, the shunt references offer more flexibility in terms of VIN range, as well as the option to stack multiple devices on top of one another to obtain higher reference voltages and the ability to create negative or floating references. 

How can you combine the shunt reference design flexibility with series reference precision?

You can take advantage of the precision and stability characteristics of the REF50xx family by externally connecting the VIN and VOUT pins together.  By doing so the series voltage references in this family are essentially converted into Zener diodes but with greatly diminished negative effects of shot noise and reverse-breakdown resistance.  While any of the seven devices in this family could be used, I’ve selected here the REF5050 (5V output) and REF5010 (10V output) for my illustrations below.

The simplified schematic in Figure 2 shows the REF5050’s two main circuit components: BandGapAmp, with its gain stage responsible for assuring constant VOUT voltage over temperature and supply variations; and the ErrAmp output stage, capable of sinking or sourcing a minimum of 10mA output load current with minimal effect on output voltage initial accuracy.

 Figure 2: Simplified schematic of the REF5050


To assure VOUT initial accuracy and temperature drift, the class-AB output transistors must all operate in their linear region; thus, VDS must be greater than the transistor saturation voltage, Vsat.  Therefore, the input voltage, VIN, of a series voltage reference must be at least a dropout voltage above VOUT; see the circuit in Figure 3.  The dropout voltage is the minimum voltage difference between VIN (source) and VOUT (drain) under a given load, and in case of the REF5050, the minimum dropout voltage under quiescent condition (Iout=0) is 200mV.

Figure 3: Placing REF5050 ErrAmp Output Stage in Shunt Configuration


However, by externally connecting VIN and VOUT together, as shown on the right in Figure 3, VDS = 0V and the upper output transistor, PCH, gets completely shut off.  Under such conditions the output bias current, IQ, bypasses the PCH transistor entirely and flows directly from VIN to a lower output transistor, NCH. This establishes precision reference voltage between VIN and GND.

By shorting VIN and VOUT, the REF5050 is effectively transformed into a two-terminal shunt voltage reference, but it maintains the DC and temperature precision of a series voltage reference. Under this arrangement, the output stage biases up at a somewhat higher quiescent current than typical but the precision and stability of the REF5050 remain unchanged. 

Figures 4 and 5 are examples of circuit configurations using the REF5050 and REF5010 as the basic building blocks.

Figure 4: The REF5050 used in a positive and negative shunt configuration


Figure 5: Stacking REF5010 for high- and REF5050 for dual-voltage shunt configuration


Given Rs is appropriately sized for required maximum output loading, using REF5050 or REF5010 as shunt reference, as shown above, imposes no limit on the maximum power-supply voltage since most of the voltage drop and power will typically be dissipated in Rs.  Therefore, as a simple two-terminal device, REF50xx family of series voltage references configured as a shunt can be used in innovative circuits such as negative, dual and floating references.  Additionally, multiple devices may be stacked on top of each other to obtain virtually any desired reference voltage.

The two-terminal application arrangement of the REF5050 has excellent characteristics which are closely related to an ideal Zener diode.  The serial connections of REF5010 basic shunt blocks allow exceptionally high voltage references to be built (in thousands of volts) with very high voltage precision and superb temperature stability.

Additional resources:

Power Tips: How to measure Bode plots with DCAP regulators

$
0
0

Control-loop gain, which can be plotted in a Bode plot, is a good indicator of system stability. Control-loop bandwidth also directly affects transient response performance.

DCAP™ or DCAP2™ /DCAP3™ regulators (which I’ll refer to as DCAPx in this discussion) became popular for their simplicity. The DCAPx poses a challenge for engineers when it comes to measuring control-loop gain. It is tempting to measure the Bode plot by breaking the loop at the top of the feedback resistor divider as shown in Figure 1. This is proper for traditional control architectures where there is only one output feedback path and the feedback goes through the compensator before pulse-width modulation (PWM).

Figure 1: Conventional control-loop gain setup

Rather than the traditional voltage-mode or current-mode control architectures, the DCAPx control system has two direct output feedback paths: one through the feedback resistor divider network, and the other through the direct current resistance (DCR) injection circuit, as shown in Figure 2. The DCAPx control system does not have a high DC gain error amplifier like the traditional type II or type III compensator. PWM pulses are modulated at the FB pin. The FB pin is usually the negative input of the error amplifier for traditional control architectures. For DCAP, DCAP2, DCAP3, it is one of the input of the PWM comparator.


Figure 2: Block diagram of a DCAP regulator with a DCR injection circuit

By leaving one of the feedback path outputs of the measurement, the Bode plot measured using the setup shown in Figure 1 does not directly correlate to the transient response. To properly measure the loop-gain Bode plot, the loop breaking point should include both feedback paths, as shown in Figure 3.

Figure 3: Proper DCAP regulator control-loop Bode plot measurement setup

For DCAPx regulators, the PWM modulation gain is determined by the falling slope of the triangular waveform formed at the FB pin by the DCR injection network and output-capacitor equivalent series resistance (ESR). The parasitic inductance and resistance along the disturbance-injection cable and noise coupled into the wires would tort the triangular waveform at the FB pin, thus rendering a different PWM modulation gain than that of the regulator without the test setup.

To preserve accuracy, a bypassing capacitor, Cpass, is added in parallel to the 20Ω resistor. The 20Ω resistor and Cpass form a high-pass filter. The corner frequency is set at lower than half of the converter switching frequency so that the triangular waveform at the FB pin during the testing remains similar to that during normal operation.

I used 0.22µF for a converter switching at 500KHz. For most applications, the proper Cpass value is from 0.1µF to 0.47µF.  To minimize the effect on the system, the DCR injection capacitor, Cp, should be less than one-tenth of Cpass, as shown in Figure 3.

Figure 4 shows the Bode plot measurement results using the test setup shown in Figure 3. Cpass = 0.22µF and Cp = 22nF. By adjusting Rp and Cff, crossover frequency is set at one-sixth the switching frequency with a phase margin of 66 degrees. I conducted these experiments with the reference design, Step-down converter for powering rails in Altera Arria V FPGA (PMP8824).

Figure 4: Bode plots measured with the proposed test setup on the TPS53319 with DCR injection (Vout = 1.2V)

Figure 5 shows the corresponding transient response at load step-up and step-down. I also conducted these experiments with the PMP8824.

Figure 5: Load transient response of the TPS53319 (Vout = 1.2V)

For DCAP2 and DCAP3 control systems, the DCR injection circuit is integrated inside the silicon. The same technique is applicable. Figure 6 shows the loop Bode plot test setup for DCAP2 and DCAP3 regulators.

Figure 6: Proper DCAP2 and DCAP3 regulator control-loop Bode plot measurement setup

Bode plots are measurable for DCAP, or DCAP2/DCAP3 regulators.  With the technique provided in the previous discussion, Bode plots can be measured to assure system stability and to serve a guideline to optimize transient performance.

Additional resources:

A simple, efficient, single-rail solution for Intel Skylake designs

$
0
0

Are you designing an Intel Skylake system? With Intel planning to officially release the design later this year, now is the time to be thinking about what Skylake can do for you and your systems. The Y- and U-line Skylake variants (SKL-Y and SKL-U) are lower power and ideal for portable embedded systems such as tablets and notebooks.

A common question with such a high-performance processor is the power supply. The very low voltage required (typically around 1V, and frequently less) and high load current slew rates require a proven power solution. Fortunately, TI has you covered with the TPS62134x family, which is specifically designed for Skylake applications.

In portable devices, power consumption and solution size are key. The power supply should be optimized for high efficiency across the load current and input-voltage range. But high efficiency requires a two-pronged approach. The power supply must be efficient as well as the processor. In the TPS62134x, the low IQ of the DCS-ControlTM topology provides a high-efficiency power supply (shown in Figure 1), while the processor’s low-power modes allow it to best use the available power. Compatibility with the Skylake system is further enhanced by dedicated VID and low-power mode (LPM) pins on the TPS62134x, which interface directly with the processor. No external level-shifters or other circuits are required to benefit from the power-saving modes built into the Skylake processor.

Figure 1: The TPS62134x delivers high efficiency across the load current range

Along with the power-saving circuitry, the TPS62134x also integrates both MOSFETs, the entire control-loop compensation and the output voltage divider. In fact, to complete the entire power solution, just add two capacitors and one inductor to the integrated circuit (IC) and you’re done! Or if that’s not easy enough, this TI Designs reference design shows a complete Skylake power distribution scheme for you to use.

What Intel Skylake-based products are you designing?

D-CAP3 – A sequel better than the original

$
0
0

Power system design engineers today are facing the increasing challenge of completing designs in shorter periods of time, while ensuring they’re stable over the operating environment with minimal compensation circuitry and effort. Loop compensation takes time and adds additional compensation network components increasing cost and reducing reliability. D-CAP solves this by requiring no loop compensation.

Figure 1. D-CAP Control Mode

Advanced D-CAPTM control architecture was first invented by TI in 2004 as a form of current mode control. The term “D-CAP” means the current information is ‘Directly sensed across the output CAPacitors.’ TI’s first D-CAP controller, the TPS51116, was realized by combining a controller with a constant on-time modulator. Today, TI has a family of products featuring various modulators and next-generation forms of the original D-CAP control (Figure 1).

The three forms of D-CAP control architecture are:

D-CAPmode (with external ripple injection)

  • Features either constant on-time or a fixed frequency modulator.

  • Uses ESR at the output bulk cap to stabilize the loop.

  • DCAP with external RCC can operate all MLCC output capacitors.

D-CAP2 mode

  • An output ceramic capacitor is supported with internal phase compensation.

  • An internal inductor ripple current “emulator” circuit is used to generate a sufficient ramp for D-CAP2 control to compare the output voltage vs. the reference voltage to determine whether to turn the PWM on or not.

D-CAP3 mode

  • Supports the output ceramic capacitor with internal phase compensation.

  • The duty cycle-based adaptive ramp compensation selections are implemented by D-CAP3 to improve the transient performance and LC output filter range.

  • D-CAP3 mode improves the output voltage set-point accuracy by implementing specialized circuit(s) to remove the half time ramp magnitude. Watch “D-CAP3 control mode step-down FET converters” for more information.

Note that all forms of the D-CAP control architecture use adaptive on-time control. The PWM on time is adapted by sending the VIN, VOUT and IOUT (Figure 2).

Figure 2. The PWM comparator keeps Vo constant

Figure 3. Loop Stability determined by output capacitors

How D-CAP control mode works

D-CAP control mode compares a divided-down version of the feedback voltage, which comes from the output voltage ripple and contains the output voltage, to the output voltage set point, and decides whether to turn the PWM on or not. When VBF becomes lower then VREF (the output voltage set-point), the next ON period is initiated. The ON period continues for a predetermined period, and the output voltage is offset by half the output voltage ripple so the feedback design needs to be implemented accordingly (Figure 3).

D-CAP control is basically a non-linear control mode that requires no phase compensation. It delivers faster load transient response vs. voltage and current mode control for the same load transients. This results in fewer output capacitors, higher power density, lower BOM cost and higher reliability.

Seen in Figure 4 below, D-CAP control has much faster load transient response vs. voltage mode during the same load transient conditions.

Figure 4. D-CAP control vs. voltage mode

The transient response of D-CAP is fast because the ESR of the output caps provides immediate feedback of any load change. The D-CAP PWM comparator responds with an array of ON pulse in a couple of 10ns.

The ON pulse frequency increases to a very high value, and the inductor current rises to match the output current in a very short time, thus reducing the need for output capacitors (Figure 5).

Figure 5. D-CAP control loop PWM response to load current changes

Voltage mode control uses an error amplifier which has bandwidth limitations. It provides the voltage and reference to the error amp but is slow in responding to a change in output voltage.

Additionally, although there is no clock in D-CAP mode DC/DC converters and controllers, the switching frequency tolerance is tight and extremely stable over the operating range (Figure 6).

Figure 6. DCAP-3 switching frequency vs. output current

D-CAP3, the most recent version, offers significant load regulation advantages vs. previous modes. It adds a special circuit to eliminate the internal ripple (ramp) DC offset when using MLCC output caps. This tightens the load regulation significantly (Figure 7). TI’s SWIFT™TPS53513, TPS 53515 and TPS53915 converters feature D-CAP3 control Mode.

Figure 7. Load regulation comparison: D-CAP2 vs. D-CAP3, 12Vin, 1.2Vout/500KHz

Additionally, the internal ripple (ramp) in D-CAP3 is adaptively adjusted based on the output voltage, duty ratio, output filter (LC) selection, and switching frequency to improve performance and ease of use.

With a single Rmode resistor selecting the RC (Ramp) time constant, D-CAP3 control enables optimal time and frequency domain performance as can be seen in Figure 8 below:

Figure 8. D-CAP3 RC (internal RC ramp) 
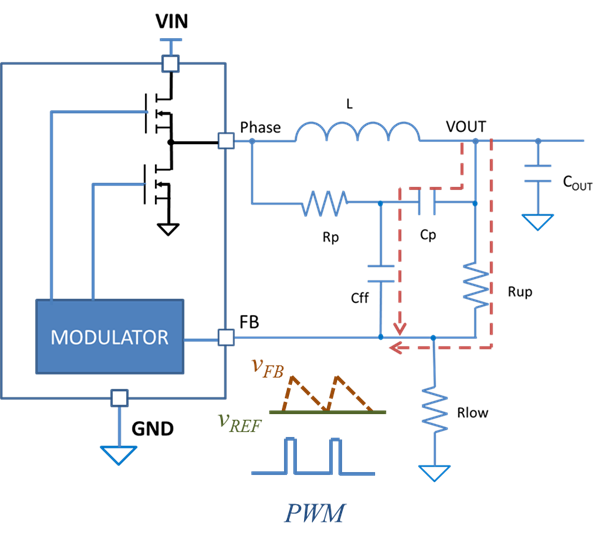
tuning for Vout=0.6V: optimized frequency and time domain performance

Reduce cost and ensure reliability in your next design with TI's products featuring D-CAP control mode. Watch “D-CAP3 control mode step-down FET converters” for more information.

STEM solutions from students

$
0
0

How do we get more students interested in science, technology, engineering and math? It’s a question being asked by academics, government officials, non-profit organizations and companies like TI.

And with the coming critical shortage of STEM workers globally, we are hungry for answers.

So we decided to ask a different type of expert.

Recently, more than 80 students from Cedar Hill Collegiate High School talked to TIers and Deloitte employees who were eager to hear their ideas on how to excite fellow students about STEM.

“What if, instead of calling it STEM, you call it STEMulate to give STEM a more exciting name?” said one high school student at the event.

We do know some of the answers – including investing time, money and technology with a particular focus on minorities and women– two groups that are underrepresented in STEM fields.

But Fran Dillard, TI’s diversity and inclusion director, asked the children if they even knew that getting kids interested in STEM subjects was a problem.

“Every kid shook his or her head no,” she said. “Before we even talk about solutions, just socializing a problem like this helps expand the awareness and create new voices to help tackle this problem.”

The students also heard from Fran and a diverse group of TIers and Deloitte employees who shared their experiences about how they developed a love for STEM subjects and ultimately for engineering. The students then brainstormed together to find solutions. Here’s what they said:

RELATED: Watch our video on why we believe Diversity Fuels Innovation

TI robotics mentors change youth's lives


Pin Configuration in the Cloud with PinMux

$
0
0

The latest version of TI's PinMux tool is available in the Cloud.  Visit dev.ti.com to browse through the TI Cloud Tools and select PinMux.  PinMux is a software tool which provides a Graphical User Interface for configuring pin multiplexing settings, resolving conflicts and specifying I/O cell characteristics. Results are output as C header/code files that can be added to projects. 

Using the tool is very simple.  You tell it which device are using and the package.  Then select the peripherals and their settings.  As you add peripherals to your configuration it automatically determines the optimal pin configuration.  When you are done the tool then generates the source code to add to your project.  Now that the tool is available in the cloud you don't even have to install any software to use it.

Check out the video below to see it in action.

(Please visit the site to view this video)

How to spin your stepper motor more efficiently, Part 1

$
0
0

It’s no secret that we love stepper motors here at TI. We love them so much that we work to come up with integrated circuits (ICs) and development tools that make stepper motors easier and easier to drive. We have small-form-factor BoosterPacks to encourage prototyping; innovative product features like adaptive decay to eliminate motor tuning; and a wealth of driver ICs with integrated indexers, integrated or external power stages, and the full gamut of protection features.

Figure 1: The DRV8711 BoosterPack: TI’s adoration for stepper motors is unfortunately not reciprocated


Stepper motors are unique among their motor comrades because they make position control really, really easy. Brushed and brushless DC motors require closed-loop position feedback in order to control where the rotor is; steppers are driven open loop so that you always know what step the rotor is at. This makes the stepper motor useful for a wealth of applications: stage lighting, security cameras, cash machines, medical analyzers, textile equipment, and scanners and printers. 3-D printing is an awesome example of using stepper motors to control position.

Figure 2: 3D printed figures: No one understands the benefits of 3-D printers until they get to print these little guys out


The disadvantage of the stepper motor is the same as its advantage – it is driven open loop. To prevent the motor from stalling, steppers must be driven with enough current so that the motor has adequate torque margin for any situation. This means that stepper motors may run a little bit hot, especially compared to their brushless-DC counterparts. Stepper motors can be very power-hungry.

I spent some time researching how to run a stepper motor more efficiently and asked myself several critical questions:

  • If the stepper motor is running unloaded, is there any way to detect that free-spinning condition and decrease the output current?
  • If the motor load increases, can you increase the current to prevent the motor from stalling?
  • Can I actually write a blog about stepper motors without spending half the time talking about current regulation?

Figure 3: Current regulation in a stepper motor during increasing and decreasing steps: No – I will not give in!


Leaving the last question aside and hoping for the best, I looked into methods of determining load on a stepper motor. Motor back electromotive force (EMF) seemed promising, as the back-EMF voltage will decrease as the motor is loaded down. At least in theory, you can look at the back EMF and set the stepper-driver output current based on that back-EMF measurement.

My theoretical system magically measures the back EMF and sends the data to the controller. The controller adjusts the stepper-driver output current back into the stepper motor, thereby creating closed-loop operation. The only caveat is that back EMF is only present when the motor is spinning. So this method will not work if the stepper motor is holding position or rotating very slowly.

Figure 4: Step 1: spin motor. Step 2: back EMF. Step 3: ?? Step 4: profit.


Back EMF can be difficult to measure in any motor because it gets hidden when the motor windings are energized. As current flows through the winding, the voltage you see across the motor is equal to the back EMF plus the I x R from the resistance of the motor. You would need to back-calculate what the back EMF is, based on what you know about the motor and the current. This calculation method seems pretty difficult, so I don’t want to do it. And I’m very thankful that I don’t have to, because whenever a stepper motor is being microstepped, there is a step in which the current through the winding is zero. This “zero current step” seems to be the perfect time to measure the motor back EMF.

Figure 5: On falling steps, use a more aggressive current regulation ... WAIT! NOT SUPPOSED TO TALK ABOUT THIS


Of course, now we need to know when this zero-current step occurs so that we can actually measure the back EMF at the right time. This is very difficult because most stepper drivers with indexers will not tell you each time they reach a zero-current step. So you will either have to find a stepper driver that automatically samples the back EMF, or go the difficult route and manually drive the stepper motor with two independent H-bridges and control each step of the current waveform with the controller.

Spoiler alert: The DRV8711 is a stepper gate driver that actually samples the back EMF for you.

In the next installment of this blog series, I’ll go into detail about my prototype of a power-efficient stepper driver using the DRV8711 BoosterPack and MSP430™ LaunchPad Value Line development kit.

Additional resources:

DRV8711 Quick Spin and Tuning Guide

DRV8711 Decay Mode Setting Optimization

Adding Wi-Fi to smart meters is easy and cost-effective

$
0
0

Wi-Fi® wireless networks have struggled to gain acceptance in the growing market for smart electric meters around the world, with very few utilities having deployed meters with Wi-Fi in their territories and few smart meter OEMs even offering Wi-Fi as a communications option. But Wi-Fi does have several advantages for smart meter networks.

Wi-Fi can offer direct connectivity to a building owners’ existing network without the need for any additional equipment such as a home energy gateway. Consumers can monitor their energy consumption via their smartphones or home PCs in a much simpler way than if their smart meter used other wireless connectivity technologies such as ZigBee®.

 For electric utilities, the addition of Wi-Fi to their smart meter program can simplify meter installation and maintenance by allowing technicians to test and diagnose any meter problems by connecting through a secure Wi-Fi channel rather than using custom equipment to connect with the traditional optical port.

 TI has recently published a new TI Design reference design demonstrating how easy it is to add Wi-Fi capability to a smart meter. The new TIDC-3PHMTR-WIFIXR design uses the low-power SimpleLink™ Wi-Fi CC3100 wireless network processor and the ultra-low-power MSP430F6779 microcontroller (MCU) to implement a polyphase smart meter that directly connects to standard Wi-Fi networks and uses a web browser to display all the meter’s energy consumption data.

The SimpleLink Wi-Fi CC3100 device is a fully-integrated Wi-Fi connectivity solution expressly designed for simple operation with embedded MCU systems. A common serial interface is all that’s required to connect to the CC3100 chip along with a minimal software driver running on the MCU. The CC3100 device integrates the entire 802.11. b/g/n radio, baseband, and MAC along with WPA2 personal and enterprise security and embedded TCP/IP and TLS/SSL stacks, HTTP server along with other internet protocols.

The MSP430F6779 device is a single-chip MCU for polyphase smart electric meters. It exceeds the IEC or ANSI standards for Class 0.2 accuracy across a wide 2000:1 dynamic range by utilizing its seven integrated 24-bit sigma-delta analog-to-digital converters (ADCs).

The combination of TI’s industry-leading MSP430 MCU for energy measurement plus the low-power SimpleLink Wi-Fi CC3100 solution makes adding Wi-Fi connectivity to smart meters easy and cost effective. Consumers will benefit from easier access to their energy consumption data and utilities can benefit from lower cost of ownership.

To learn more about TI technology in smart meters visits: www.ti.com/metering

(Please visit the site to view this video)

High-current amplifier applications made smaller

$
0
0

Often, when defining a new device to meet rigorous automotive standards, our teams see other systems that require the same capabilities, and we’ll design the device to cross all these applications. This is what happened when our team was developing the new ALM2402, a dual high-current operational amplifier (op amp) designed for automotive applications.

While defining the ALM2402, we realized that many automotive and industrial systems require an op amp that can drive high-current capacitive or inductive loads.

In the past, designers have often been required to solve this need with discrete components. To design a simple high-current amplifier with discrete components, you need an amplifier, bipolar junction transistors (BJTs) and diodes. An example of this is shown in Figure 1, which is typically used in a motor drive application. This implementation drives the excitation coil of a resolver, which is used to measure degrees of motor shaft rotation. You can find amplifier designs like driving inductive loads in many automotive and industrial applications. This typical solution creates challenges for the designer around board space and biasing of the output transistor.

Adding to the space challenge of the discrete implementation is the need to provide additional circuitry for overcurrent protection. Without overcurrent protection, the system is “dumb.” It will keep burning power without any protection.


Figure 1: Discrete implementation of driving an excitation coil

 In contrast, let’s look at the ALM2402 implementation for driving an excitation coil, shown in Figure 2. Simple, right? No biasing of the external transistor is required, and the ALM2402 can drive up to 400mA through each channel. The circuit is small, housed in a 3-mm x 3-mm DRR package, which allows designers to minimize their overall solution size.

Figure 2: Excitation coil drive using the ALM2402-Q1

Protection is a critical requirement in high-current driving applications, and the ALM2402 integrates several system protection features, including the following:

  • Integrated overcurrent protection
  • Output short to battery if a series diode is connected from the battery to the supply pin of the device. Over-temperature protection shuts down the device if there is an error in layout or a higher-than-specified ambient temperature in the system.

In addition, the device’s flag pin is a handy feature that serves several purposes. The flag pin goes low when an over-temperature event occurs, allowing users to design a feedback mechanism to shut down the system. These can also externally pull down the flag pin to shut down the op amp, which puts it in sleep mode to consume very low current. This feature is useful for battery applications where power consumption is of utmost importance.

Being a high-current operational amplifier, the ALM2402 could be useful for many applications, in addition to motor drives and LED-driving applications. In future posts, I will discuss additional applications that can be implemented using ALM2402.

Additional resources:

Solid electrolyte interphase: A necessary evil

$
0
0

Figure 1: Solid Electrolyte Interphase (Source)

The term “solid electrolyte interphase” (SEI) often comes up in lithium-ion (Li-ion) battery literature. It is important to understand what SEI is at a high level, as this component is one of the main contributing factors to Li-ion battery aging and resistance.

Three major components of a Li-ion battery are the anode, cathode and electrolyte. During the charging process, the positive Li-ions are transferred from the cathode to the anode through the electrolyte. However, the electrolyte is electrochemically and thermodynamically unstable under the open charging voltages of Li-ion batteries. Upon contact with the Li-ions and anode electrode, the reactive elements in the electrolyte undergo reductive reactions (by accepting electrons from the anode electrode). The decomposition of electrolytes leads to the formation of SEI at the surface of the anode, accompanied by an irreversible loss of Li-ions.

A good SEI passivation layer is permeable to Li-ions and impermeable to electrolytes and electrons. This can allow reversible diffusion of Li-ions without any consumption, and effectively prevent the electrolyte from further reduction. Although SEI formation at the anode takes place mainly in the first few charge/discharge cycles, SEI continues to grow and change composition throughout the battery’s entire life.

Since SEI is made up of electrolyte decomposition products (Figure 1), the composition and properties of the electrolyte determine the formation of the SEI layer. Commonly used commercial electrolytes are carbonate-based, including ethylene carbonate (EC), ethymethene carbonate (EMC) and dimenthle carbonate (DMC). Stable SEI formation requires beneficial electrolyte properties, such as retention of the SEI interface during volume expansion and contraction of the anode and high conductivity of the Li-ions.

An effective and stable SEI is crucial to a battery’s long-term cycling performance. Degradation of SEI negatively impacts battery life. Components in SEI, such as lithium alkyl carbonates and lithium alkoxide salts, are thermally unstable and sensitive to moisture. Decomposition can cause SEI to dissolve/peel off/evolve during the cycling process, leading to further corrosion of anode material. Solvent co-intercalation, gas evolution and volume changes also accelerate the degradation process of the anode, with further growth of the SEI layer and a thicker diffusion barrier for the Li-ions. In summary, SEI formation and growth directly contribute to an increase in battery impedance, capacity fade and power fade.

Additional Resources:


16-bit settling for your high-throughput data acquisition system

$
0
0

Designing high-performance multiplexed data-acquisition (DAQ) systems with high throughputs can be difficult. That’s because the entire system, shown in Figure 1, only has up to the maximum time between conversions of the analog-to-digital converter (ADC) to settle within one-half of a least significant bit (LSB). For example, if the ADC is operating at a 1-MSPS throughput, the system must settle in less than 1µs; but for a robust design, it is best to have the system settle to one-half LSB in 500ns. Choosing the settling time to be 1µs would not give you any extra time for variation in component specifications, temperature drift, process shift or aging over the product’s life – and would likely result in error.

Figure 1: Multiplexed DAQ system


In order to understand the tight time constraint on the settling time, let’s go through an example of what’s occurring during the acquisition and conversion periods of the ADC. Figure 2 shows a simplified schematic of what’s inside the ADS8860.

Figure 2: ADS8860 internal simplified schematic


Figure 3 shows a timing diagram of the system with the ADS8860 operating at 1MSPS. During the acquisition period (ACQ) of the ADC, the switch in Figure 2 is closed and the sample and hold capacitor, CSH, charges to the voltage at the input of the ADC. Once the acquisition period ends, the conversion period (CONV) begins.

During conversion, the switch is open and the ADC converts the voltage that CSH was charged to during acquisition into a digital value. Therefore, if the system does not settle to the proper voltage before conversion starts, shown by the red line in Figure 3, CSH will not charge to the correct voltage, resulting in a conversion error. 

Figure 3: System timing diagram


Choosing the correct operational amplifier (op amp) to drive the SAR ADC will help optimize system performance. The op amp needs to have excellent AC performance, such as low total harmonic distortion (THD), low noise, fast settling time, high slew rate and a high gain bandwidth (GBW). 

The low THD and noise specifications are important so that the op amp does not degrade the performance of the ADC. The high GBW, fast settling time, and high slew rate are most important when trying to achieve fast settling. The high slew rate and fast settling time are necessary because you want a fast, large signal step with minimal ringing. If the op amp has a slow slew rate and a long settling time, it will take a long time for the large signal to transition to the final voltage and a long time for the small signal to settle within the desired error band.

An op amp that meets all of the criteria I’ve described is the OPA625. The OPA625 has a GBW of 120MHz, a slew rate of 115V/µs, 16-bit settling with a 4V step of 280ns, voltage noise of 2.5nV/, and a THD specification of -135dB at 10kHz. All of these specifications make the OPA625 to drive an ideal SAR ADC and achieve the fast settling requirements for a high-performance multiplexed DAQ system.

Check back in a couple of weeks where I will talk about the circuit configuration for driving the ADS8860 with the OPA625; how the requirements to drive the ADS8860 effect stability; and finally, measured data showing the OPA625 settling to one-half LSB in 500ns while driving the ADS8860.

Related resources:

In honor of Cinco de Mayo – Five revolutionary reasons why the C6678 DSP is easy to program

$
0
0

Welcome to third and final post of the blog series discussing the applications and innovative features of TI’s C6678 multicore DSP. We have had a lot of interest lately on how programming a TI C6678 DSP is about as easy as any other processor. So in continuing the Cinco de Mayo celebration, I will share five (and I have to admit, I had to hone the list to stick with this number) compelling reasons why software programmers and system architects have found ease in developing an efficient C6678 DSP-based implementation.

No assembly required– I mentioned this in the last blog but it bears repeating; the C6678 multicore DSP is programmed using C language. Even if you haven’t programmed a DSP before, you can leverage your C, C++ skills and easily develop an efficient solution using fixed or floating point operations, or even both within a single program.

A robust, optimized compiler– Some skeptics may say, ok, I can program with C but don’t I need assembly code to get a real optimized solution? Well, the answer is: not with the TI C6678! The C6678 is supported by the C6000 compiler, a tool that has continued to evolve the optimization performance, to expand the programmer guidance and tips, along with features like native vector operations and intrinsics support. So, C programmers don’t be concerned!

TI RTOSand Multicore Software Development Kit (MCSDK)– Ok, so we now have a common programming language with a comprehensive yet efficient compiler. By design, applications that benefit from digital signal processing functions operate in real time yet often require pre-emptive schedulers offered by operating systems. Again, the C6678 DSP delivers by support from the TI-RTOS (SYS/BIOS) along with the MCSDK offered complimentary to all C6678 DSP developers. The MCSDK includes peripheral drivers and chip support libraries pre-integrated with the TI-RTOS.

CCS IDE environment– Are you feeling a bit more comfortable about developing a solution on a C6678 DSP? I would be remiss without noting that all of these DSP tools are supported from the popular Code Composer Studio (CCS) development environment. Developers program, debug, integrate and test all from this single IDE; available for download from the TI website or now via the cloud.

OpenMP support– Alright, I know what the final question is, ok; all of this is great for a single core DSP! However, the C6678 has eight DSP cores, how do I manage and optimize my code across all cores? Have no fear, the C6x compiler and MCSDK support the standards-based OpenMP API that enables a simple yet flexible path to program partitioning across all cores. As a matter of fact, one of our C6678 DSP customers used OpenMP to migrate their previously single core application to the C6678, greatly expanding their product capability, and without degrading the performance on each core.

There it is, there are the five reasons TI’s DSPs are easy to program. I hope that you have enjoyed the series and have learned a bit more about the C6678. We anxiously await the celebration of your new revolutionary product based on this DSP! I would love to hear any feedback or ideas regarding this C6678 DSP or others. In the meantime, keep up with DSP news and innovations on our TI Dream DSP page!


Endless possibilities for power system improvement with GaN

$
0
0

The recent introduction of power gallium nitride (GaN) and silicon carbide (SiC) field-effect transistors (FETs) into the market are opening up many possibilities for system improvements. As power-conversion designers, we are always in need for lower losses, not only to reduce the cost of heat sinks and fans but also because of the energy-saving possibilities that provide rapid payback for designing-in higher-cost wide-band gap devices.

Radio frequency (RF) engineers were among the first to embrace GaN as a way to meet higher power, higher linearity and higher RF amplifier efficiency targets for cellular base stations and other high power RF systems such as radar. RF analysis tools such as Smith charts and spectrum analysis provides key learnings to gain insight into ways to improve higher-frequency power-conversion designs including GaN. The most common use of Smith charts is to understand how transmission lines change the impedance of PCB traces and passive elements.

Figure 1 Smith Chart

PCB Parasitics

RF engineers don’t just try to minimize board parasitics, they typically design the parasitics to be a specific value, and take into account the transmission line effects that cause the parasitics to be a function of frequency. For example, it is common to implement broad band capacitors as open circuited stubs and inductors as short circuited stubs. It is also common for passive devices such as surface mount resistors to be modeled for their equivalent capacitance to ground from each pad and their series inductances due to their length that turn the resistor into a lossy low pass filter.

Smith Charts 101

Smith charts are graphical aids especially used by electrical engineers specializing in RF. Open circuits plot as the right most point.  Short circuits plot as the left most point. All other impedances are plotted based on their real and imaginary values as a ratio to the impedance of the signal path they are propagating in, for example 50ohms. In a 50 ohm system, an ideal 50ohm resistor would be plotted as a point in the center of the Smith chart.  Adding a length of transmission line (e.g. PCB trace) between an open or short circuit causes the impedance looking into the transmission line to change. If the length of line is 0.25 wavelengths long, the open will look like a short or the short will look like an open.

There are many free online Smith chart tools such as the one from Fritz Dellsperger from Bern University. This tool allows simple circuits to be plotted and analyzed as a function of frequency.  I also like the smartphone app from Seward Salvage. Just search “Seward Salvage” in the app store.

PCB Trace Lengths

The length of the PCB trace between the measurement point and the open or short must be converted into a fractional wavelength to see how much the open or short is rotated (clockwise) around the Smith chart. The wavelength of a signal at a specific frequency follows the relationship: 

lamda = c/f. Where c is the speed of light in the medium and f is the frequency

For Air, c = ~3x10^8 meters/sec. For PCB materials, such as FR-4, the wavelengths will be shorter as a function of the square root of the dielectric constant. For striplines in FR-4 material, the dielectric constant is approximately 4 and the wavelengths are half of what they are in air. This also means that an impedance is rotated twice as much for a PCB transmission line than what it would be in an air filled waveguide.

Wavelength (medium) = Wavelength in air/SQRT(dielectric constant)

RF designers must take into account the length of a signal path and the impedances as a function of frequency along that path to determine how their circuits will perform. Power conversion designers have felt that their frequencies are low enough to ignore transmission line effects but that is no longer true with GaN based power designs with switching frequencies above 10MHz and with harmonic content above 100MHz. For example, I used a network analyzer to measure the impedance of a top layer trace, approximately 5mm by 6mm that was 5mils above a ground plane on layer 2. Figure 2 shows the impedance verses frequency, from 5MHz to 1GHz.


Figure 2 5mm x 6mm Trace Capacitance and Resonance

Note that an ideal capacitor would plot only along the negative imaginary (bottom half) outer circle of the smith chart, starting at the highest impedance point where the capacitor has an infinite impedance and then move along clockwise toward the low impedance side as frequency is increased. At 100MHz this pcb pad/trace is 2.9 – 189.2j ohms. The self-resonance loop near the stop frequency of 1GHz is due to the size of capacitor and transmission line effects.

Figure 3 is the parasitic inductance of a 0.10 ohm SMT resistor used to measure current.

Figure 3 SMT Resistor plus parasitic series inductance

Ideally this resistor would have no inductance and simply plot as a point just inside the 0 ohm, left most point on the Smith chart at 0.1ohm.  Note that as the measurement frequency increases, the inductance of the resistor starts to dominate. At 20MHz, the resistor measures 0.112 + .132j and the inductance is determined to be ~1nH. At 500MHz, the bandwidth needed to accurately see a current rise time of 3.5ns possible with this GaN FET, the inductance impedance is ~3ohms, 30x larger than the DC value.

To learn more about TI’s GaN technology visit our GaN solutions website. Stay tuned for future Power House blogs on designing with GaN using RF power techniques.

Inductive sensing: How to configure a multichannel LDC system - part 2

$
0
0

In my previous post, I explained the benefits and configuration of a multichannel inductive-sensing system with the latest expansion to TI’s inductance-to-digital converter (LDC) portfolio. In this post, I’ll explain how to calculate the timing characteristics of single- and multichannel LDC systems.

Similar to the LDC1000, the new multichannel LDCs have a data-ready signal (DRDY) that can detect when a new data sample is available. Additionally, the timing of the multichannel LDCs is fully deterministic; therefore, it is possible to calculate when a data sample is ready without having to poll the DRDY signal or use the interrupt pin.

The scope plots in Figures 1 and 2 show single-ended measurements of the sensor-input pin in single- and multichannel mode, respectively. In this example, the LDC has been configured with a relatively short conversion time of 128 FREF cycles (CHn_RCOUNT = 0x08), which allows high sample rates at the cost of lower measurement precision.


  Figure 1: Single-channel configuration timing (single-ended measurement on IN0A: yellow and IN1A: cyan)


Figure 2: Dual-channel configuration timing (single-ended measurement on IN0A: yellow and IN1A: cyan)

 Timing of the LDCs is deterministic and can be broken down into:

  • Wake-up time. This is the time it takes to wake up the device from shutdown mode to sleep mode.
  • Wake-up from sleep time. This is the time that the device needs to change from sleep mode to active mode.
  • Sensor-activation time. Sensor-activation time is configured for each channel individually in the SETTLECOUNT_CHn registers in 0x10, 0x11, 0x12 and 0x13. It is possible to select different sensor-activation times if the sensor characteristics differ from channel to channel. This time is specific to the sensor characteristic and should allow sufficient time for the sensor to settle. The time that it takes for an LC tank to settle depends on its Q-factor and its sensor-oscillation frequency. An LC tank with a high Q-factor takes longer to settle than one with a lower Q-factor, and an LC tank with a high sensor frequency settles faster than one with a low sensor frequency. The sensor-activation time applies when a particular sensor is activated. In single-channel mode, it only applies once, when sleep mode is disabled. In multichannel mode, sensors are automatically shut off when not in use, so the sensor-activation time applies every time the LDC switches channels. Setting this time too short for a given sensor design can degrade measurement performance. Setting it longer than it needs to be does not impact performance, but adds an additional delay and is therefore not advisable in applications that rely on high sample rates.
  • Conversion time. Frequency measurement takes place during the conversion-time interval, which is set in the RCOUNT_CHn registers in 0x08, 0x09, 0x0A and 0x0B. The time it takes to convert one sample can be between 80 FREF clock cycles (2µs at CLKIN = 40MHz) and 1,048,560 FREF clock cycles (26.2ms at CLKIN = 40MHz). Faster conversion times allow higher sample rates but lower measurement precision, as shown in the application curves of the data sheet. You can choose the conversion-time interval for each sensor individually; therefore, it is possible to meet requirements in systems where different channels have different specifications for measurement precision.
  • Switch delay.The channel-switch delay applies in multichannel mode only and is used to shut down one sensor and switch to the next sensor in the sequence.

 In summary, in a multichannel system, the dwell-time interval for a single sample is the sum of three parts:

  • Sensor-activation time.
  • Conversion time.
  • Channel-switch delay.

 As shown in Figure 2, one conversion takes 1.8ms (sensor-activation time) + 3.2ms (conversion time) + 0.75ms (channel-switch delay) = 16.75ms per channel. If the LDC is configured for dual-channel operation by setting AUTOSCAN_EN = 1 and RR_SEQUENCE = 00, then one full set of conversion results will be available from the data registers every 33.5ms. If the device is configured in quad-channel mode instead (by setting AUTOSCAN_EN = 1 and RR_SEQUENCE = 10), then one full set of conversion results would take 67ms to complete.

 To determine the timing in different configurations, see the Inductive Sensing Design Calculator Tool.

 If you are using the LDC1312, LDC1314, LDC1612 or LDC1614 in your designs, be sure to check out the next installment in this series, when I’ll talk about the extended-range benefits and superior measurement performance of the LDC1612 and LDC1614.

 Additional resources

Why high-voltage power rails make your battery charge faster

$
0
0

Most single-cell, Li-ion rechargeable battery-powered electronics need to communicate with a PC at some point. In addition to providing a standard communications protocol, a PC’s USB port typically provides 5V power rails with limited current output (such as 500mA). Thus, integrated field-effect transistor (FET) battery chargers were historically designed to be powered from 5V USB power rails.

As the functionality and related power demands of electronic devices grew, so did their batteries’ capacities in order to extend the devices’ operating life. A rough estimate for charging a battery is 1.5 times capacity (mAHr) divided by the maximum current from the battery charger. A 95% efficient buck-switching converter-based charger with 5V, 500mA USB input power could provide at most a 570mA charge current, and so would require 15 hours to charge a 5,700mAHr tablet battery.

Luckily, USB3.0 offers 900mA and USB3.1 offers 2A output current at 5V. With USB3.x providing more current at 5V, simply increasing the charger’s input-current limit gives more output current and faster charging, right? Not necessarily.

A buck charger integrated circuit’s (IC) efficiency, h = POUT/PIN = (VBAT*ICHRG) / (VBUS*IBUS) and losses through heat, PL = PIN-POUT, are dominated at higher currents by I2R losses across its internal FETs. When a buck charger’s input voltage is close to its output voltage (high duty cycle), the high-side FET is on for longer periods than the low-side FET, which results in those losses across the high-side FET dominating: IIN(AVG)2*RDSON(HIGH). If the buck charger was designed exclusively for high-duty-cycle operation, then its high-side FET’s RDSON would be typically much lower than that of its low-side FET.

Figure 1 illustrates the difference in charge time for a 14.8Whr battery charged from two different 2.5A-rated chargers, each having different internal FET resistances and powered from 4.5V to simulate the minimum (worst-case) USB rail.


Figure 1:  FET Resistance Effect on Battery Charge Time

In addition to FET RDSON, printed circuit board (PCB) trace, connector and cable resistances lower the charger’s efficiency and maximum output current. If large enough, those resistances may result in the buck charger operating in 100% duty operation, where its charge current is reduced to its input current. So simply increasing your existing charger’s input limit to match the new USB3.0/900mA or USB3.1/2A output current at 5V may not necessarily result in a higher charge current and shorter charge time.

Because of the lower switching currents compared to those with the same output power level from a 5V input rail, using USB3.1 12V input power virtually eliminates the risk of a single-cell buck charger entering 100% duty cycle due to PCB trace, connector, internal FET or cable-resistive losses. And if the charger’s internal low-side FET resistance has been reduced for low-duty-cycle operation, the 12V-powered charger’s efficiency will be in the mid-90% range, with cool case temperatures, even at a charge current close to 5A. As shown in Figure 2, a USB3.1 12V-powered charger could charge a 29.6Whr battery – twice the size of the battery in Figure 1 – in less than three hours.


Figure 2: Max Charge Current Effect on Battery Charge Time

To get the highest-efficiency, coolest-charger IC – and therefore the shortest charge times – consider internal FET resistances when comparing chargers. A charger with a lower high-side FET resistance is best for 5V-powered charger ICs, while one with a lower low-side FET resistance is best for 12V rails. For the shortest charge times from 5V and 12V, choose a charger with low high-side and low-side resistances.

For more information on TI’s Max Charge technology check out these additional resources:

Out of Office: Extreme running through the Grand Canyon

$
0
0

TI AvatarTIers do amazing things every day at work and when they are out of the office. In our ongoing series, ‘Out of Office,’ we showcase the unique and fascinating hobbies, talents and interests of TIers all over the world.

Jorge Reynaga felt every beat of his heart as it rapidly pounded against his chest. The TIer’s legs acted like two 1,000-pound weights. His feet ached, lips chapped and head throbbed. He was hungry, tired and thirsty.

To the left of Jorge, a runner sat on a rock, shivering in the cold Arizona desert night. Farther up on the right, another runner vomited on the side of the trail. But Jorge just kept running, knowing he couldn’t stop. He didn’t want to end up like the runners he passed. Jorge was 18 hours and 43 miles into one of the most extreme running events in Arizona, and five more miles and 3,000 vertical feet stretched out in front of him.

TI Avatar“As far as I know, there are no search and rescue services inside the Grand Canyon at night. I know that I have to push myself beyond my limits,” said Jorge, a test and characterization engineer in High Performance Analog’s Precision Analog (PA) business unit at the TI Tucson, Arizona site.

For the last two years, Jorge participated in the Rim to Rim challenge – an unofficial, unsanctioned race through the Grand Canyon. Runners start at the top of the south rim, down 5,000 feet into the canyon, nine miles across the bottom of the canyon and up 6,000 vertical feet to the top of the north rim. That’s 24 miles, which Jorge ran in 10 1/2 hours during his first Rim to Rim two years ago. Last year, he took it a step further – completing the Rim to Rim to Rim – in 22 hours and 48 minutes.

Friday night, starting at midnight, Jorge will begin this 48-mile trek yet again, and he has recruited TIers from all over the world to run with him. In total, 20 TIers from Tucson, Dallas and Freising, Germany will participate in or cheer for runners in the 2015 Rim to Rim challenge.

“Running across the canyon twice on the same day is very difficult. I remember after the first 35 miles I was feeling great, but at one point after mile 45 I asked myself, ‘Why am I doing this? This is crazy.’ For some reason the last two miles are the worst, and that’s when you test your determination,” Jorge said.

Jorge’s fascination with ultimate running started with a simple hike three years ago on the outskirts of Tucson. Jorge had just moved to Southern Arizona from Las Vegas.

“I was wondering what I was going to do after work and during the weekends. Tucson is not like Las Vegas with lots of nightlife and other activities. So I decided to do what everyone else does – I headed outdoors,” he said.

TI AvatarJorge started with short 2- to 3-mile hikes. Then, he decided to add a mile to each of his trips. Before long, Jorge routinely took 8-12 mile hikes on the weekends with fellow TIers.

Jorge said he doesn’t like to plan much – he heads into the beautiful mountains around Tucson and figures out where to go and what to do once he is there. This nearly landed him in trouble during his first trip to the Grand Canyon. Jorge went to his Rim to Rim challenge without the proper clothing and equipment, and not enough food or water.

“I didn’t know what to expect when I first went there and didn’t realize just how challenging 24 miles with an 11,000 foot elevation change would be. It took 10 ½ hours, my legs were killing me and I was thinking, ‘I’m never going to the Grand Canyon again,’” he said

Jorge said he was in pain two weeks later and thought of swearing off hiking forever, when he met the Tucson Trail Runners. This group didn’t just hike – they usually ran – 20-30 miles at a fast pace through the mountains. At the very moment Jorge thought he would never step foot on a trail again, he chose to push himself even further. And Jorge never looked back.

“When you go for a long trip and your mind is really into it, you realize there is so much more than the trail you are running. Your senses awaken, and you hear little sounds around you. The shapes and colors of the flowers are sharper,” he said. “After working on a computer and in the lab all week, I like to free my mind and reenergize myself with a good run through the mountains during the weekend. I think this helps me to stay healthy and increase my productivity at work.”

TI AvatarJorge plans to run the Rim to Rim to Rim once a year and make it a tradition where more TIers around the globe will join him.

“I am amazed by the determination, passion and endurance that drives team members like Jorge and I am excited how ‘out of office’ activities like this can positively impact ‘in the office’ activities” , says Amichai Ron, PA business unit and Tucson site leader. “We know that as a team we are stronger, so I hope that Jorge will have a great team of fellow TIers around him to take on the challenge this year.”

And indeed, just a few days from now, Jorge will start his latest challenge, hearing the sounds and seeing the sites of the Grand Canyon that others may miss, pushing past fellow extreme runners gasping for air and struggling to finish, and pressing the reset button for his mind and his body – with fellow TIers with him every step of the way.

TI Live @ Maker Faire Bay Area 2015

$
0
0

This weekend there will be hundreds of Makers heading to San Mateo in the sunny state of California for Maker Faire Bay Area and we are excited to be amongst them! This show is always full of exciting and innovative products as well fellow hobbyists to share knowledge with. We have enjoyed going to the Bay Area Maker Faire over the past few years and can’t wait to see what this year’s show has in store.

If you are attending, we have a couple of great speaking sessions you can attend at the Make: Electronics stage throughout the show:

Saturday you can find Jason Kridner, co-founder of BeagleBoard.org, discussing Linux and web servers for teaching electronics. Join him at 1:00 p.m. to learn how to create interactive electronics labs and tutorials over web pages using HTML and JavaScript.

Jason will be taking the stage again at 2:30 p.m. to discuss why BeagleBone is open hardware. During this session he will discuss what open hardware is, who is making BeagleBone derivatives and much more.

Trey German, LaunchPad applications manager and Maker–extraordinaire for TI will take the stage on Saturday at 3:00 p.m. to discuss the building secrets for a Power Racing series car. We’ll be racing our car on Saturday and Sunday at the race track, so be sure to stop by and cheer us on! To learn more about the car, check out this blog post.

On Sunday, Jason and Trey will both take the stage again. At 3:00 p.m. Trey will host a session on turning common appliances into DIY connected devices. During this session he will walk through the basics of adding connectivity to appliances and learn how to write embedded firmware for a Texas Instruments LaunchPad using Energia. These are tactics he used to create his DIY barbecue smoker and Wi-Fi connected sous vide controller.

Later, at 4:00 p.m., Jason will host a session on building DIY 3D printers . Are you still using a computer, or walking over an SD card, to feed GCode build instructions to your 3D printer? Local 3D previews? Remote network status? Jason will show you a simpler way to building your own 3D printer.

There is so much to see this year and we can’t wait. Will you be attending? Let us know what you think will be the “can’t miss” attractions in the comments.  

Viewing all 4543 articles
Browse latest View live


<script src="https://jsc.adskeeper.com/r/s/rssing.com.1596347.js" async> </script>